Note
Go to the end to download the full example code.
Read a Dataset and plot Pixel Data
This example illustrates how to open a DICOM file, print some dataset information, and show it using matplotlib.
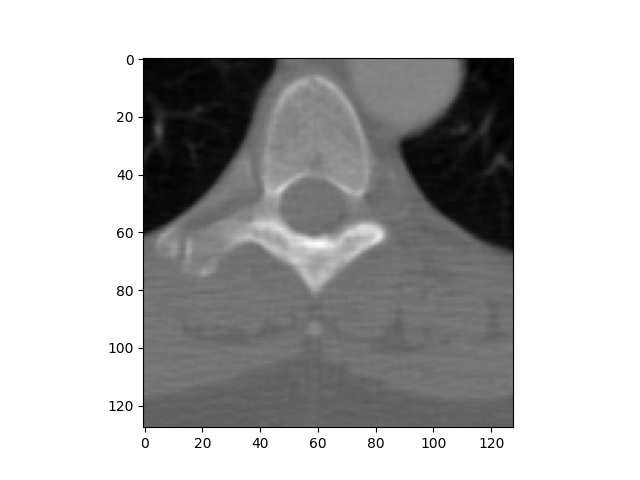
File path........: /root/project/src/pydicom/data/test_files/CT_small.dcm
SOP Class........: 1.2.840.10008.5.1.4.1.1.2 (CT Image Storage)

Patient's Name...: CompressedSamples, CT1
Patient ID.......: 1CT1
Modality.........: CT
Study Date.......: 20040119
Image size.......: 128 x 128
Pixel Spacing....: [0.661468, 0.661468]
Slice location...: -77.2040634155
# authors : Guillaume Lemaitre <g.lemaitre58@gmail.com>
# license : MIT

import matplotlib.pyplot as plt
from pydicom import dcmread
from pydicom.data import get_testdata_file

path = get_testdata_file("CT_small.dcm")
ds = dcmread(path)

# Normal mode:
print()
print(f"File path........: {path}")
print(f"SOP Class........: {ds.SOPClassUID} ({ds.SOPClassUID.name})")
print()

pat_name = ds.PatientName
print(f"Patient's Name...: {pat_name.family_comma_given()}")
print(f"Patient ID.......: {ds.PatientID}")
print(f"Modality.........: {ds.Modality}")
print(f"Study Date.......: {ds.StudyDate}")
print(f"Image size.......: {ds.Rows} x {ds.Columns}")
print(f"Pixel Spacing....: {ds.PixelSpacing}")

# use .get() if not sure the item exists, and want a default value if missing
print(f"Slice location...: {ds.get('SliceLocation', '(missing)')}")

# plot the image using matplotlib
plt.imshow(ds.pixel_array, cmap=plt.cm.gray)
plt.show()
Total running time of the script: (0 minutes 0.115 seconds)