Note
Go to the end to download the full example code.
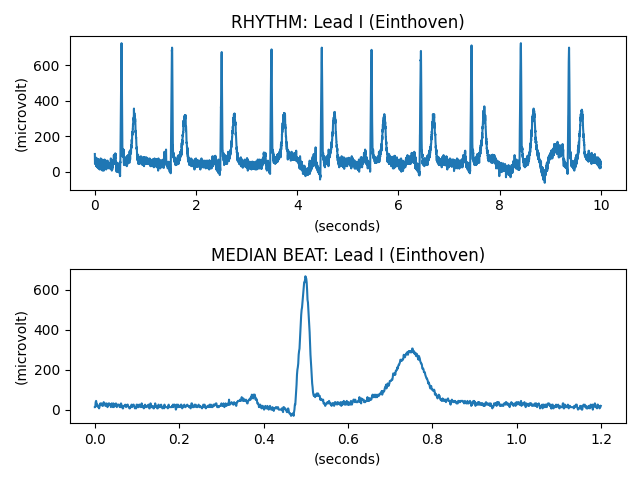
Decode and plot Waveform Data
This example illustrates how to plot waveforms from a Waveform Sequence using matplotlib.
import numpy as np
import matplotlib.pyplot as plt

from pydicom import examples
from pydicom.waveforms import generate_multiplex

ds = examples.waveform

# Plot the first channel of each multiplex
ch_idx = 0
# We could also use ds.waveform_array()
fig, axes = plt.subplots(len(ds.WaveformSequence))
generator = generate_multiplex(ds, as_raw=False)
for ax, mplx, arr in zip(axes, ds.WaveformSequence, generator):
    nr_channels = mplx.NumberOfWaveformChannels
    nr_samples = mplx.NumberOfWaveformSamples
    sampling_fq = mplx.SamplingFrequency  # in Hz
    mplx_label = mplx.MultiplexGroupLabel

    ch_item = mplx.ChannelDefinitionSequence[ch_idx]

    x = np.arange(0, nr_samples / sampling_fq, 1 / sampling_fq)
    x_units = "seconds"

    # ChannelSensitivityUnitsSequence is type 1C, so check it's there
    if "ChannelSensitivityUnitsSequence" in ch_item:
        y_units = ch_item.ChannelSensitivityUnitsSequence[0].CodeMeaning
    else:
        y_units = "unitless"

    # Description of the channel source
    ch_source = ch_item.ChannelSourceSequence[0].CodeMeaning

    ax.plot(x, arr[..., ch_idx])
    ax.set_title(f"{mplx_label}: {ch_source}")
    ax.set_xlabel(f"({x_units})")
    ax.set_ylabel(f"({y_units})")

fig.tight_layout(pad=1)
plt.show()
Total running time of the script: (0 minutes 0.212 seconds)